|
Creating a SOM Cluster Plot
Overview
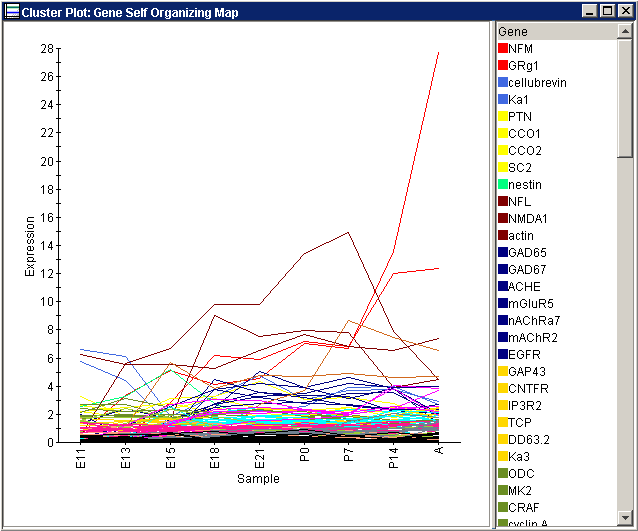
A SOM cluster plot makes it possible to visually 'drill down' into the a SOM cluster to view the individual member profiles.
Actions
1. Click a SOM experiment in the Experiments navigator. The item is highlighted.
2. Select Cluster Plot from the Clustering menu, or right-click on the item and select Cluster Plot from the shortcut menu. A cluster plot of the SOM experiment is displayed.

Using the Plot
Plot Functions
Create Gene List from Selection
Customizing the Plot
Related Topics:
Overview of Self-Organizing Maps (SOMs)
Tutorial 4: Self-Organizing Maps

