|
Configuring Plot Components
Overview
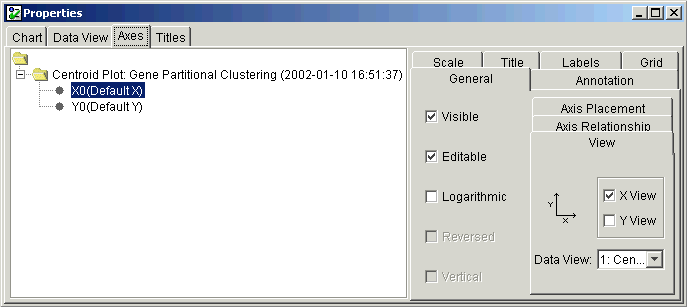
Several plots - the centroid, cluster, scatter, coordinate, scree, score, loadings line, and loadings scatter plots can be configured using this function to highlight certain features or otherwise enhance the plot. For example, you may find it helpful to customize one or more of the following properties:
foreground/background colors
line styles and colors
axis properties (e.g. logarithmic scale)
titles
All customizations made to the appearance of a plot using this function are lost once the plot or GeneLinkerô is closed.
Actions
1. Right-click on an appropriate type of plot.
2. Select Customize from the shortcut menu. The Properties dialog is displayed.

3. Click the item you wish to change, and edit the values accordingly. The plot is updated using the new values.
4. Click the ![]() icon in the upper right
corner of the dialog to close it.
icon in the upper right
corner of the dialog to close it.
Related Topic:

