|
Creating a Table View of Gene Expression Data
Overview
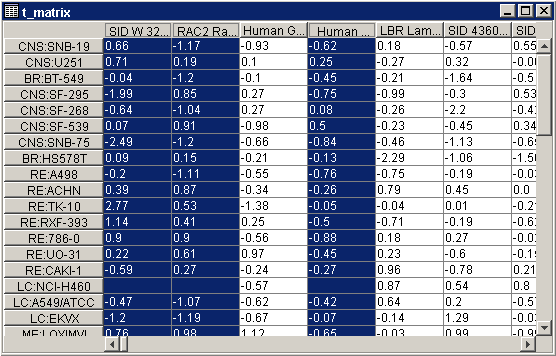
Datasets can be viewed by displaying them in a spreadsheet-like table. Genes are in columns and samples are in rows. If a gene does not have an identifier of the type specified for display in the user preferences, it is displayed in the column label using the gene identifier type that was imported for that gene.

For a regular dataset, each cell in the table contains the expression level of that gene (gene name in column label) in that sample (sample name in row label).
For a two-color dataset, each cell in the table contains a ratio expression level (Cy5/Cy3) of that gene in that sample.
A missing value is blank.
Selected column(s) or row(s) are displayed in dark blue with white text. See Interacting With the Table Viewer for full details on Table Viewer functions.
Actions
1. Click a dataset in the Experiments navigator. The item is highlighted.
2. Click the Table
View toolbar icon ![]() , or select Table
View from the Explore menu,
or right-click the item and select Table
View from the shortcut menu. A table view of the dataset is displayed.
, or select Table
View from the Explore menu,
or right-click the item and select Table
View from the shortcut menu. A table view of the dataset is displayed.

Related Topics:
Interacting With the Table Viewer

