|
Table Viewer Functions
Overview
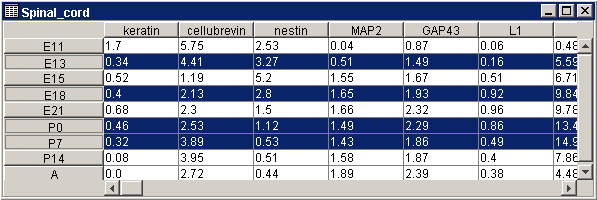
The Table Viewer displays the gene expression values for the selected dataset. You can select a single, multiple, or a series of genes or samples for display in a Coordinate Plot or Summary Statistics chart. If you select a pair of genes or samples, you can display a Scatter plot. A selection of genes also can be used to create a gene list.
Actions
1. Click on a dataset in the Experiments navigator pane. The dataset is highlighted.
2. Click the Table View toolbar icon ![]() , or right-click the item and select Table View. The dataset
is displayed in a table.
, or right-click the item and select Table View. The dataset
is displayed in a table.

Making Selections
Genes are assumed to be in columns; samples are assumed to be in rows.
Selecting a single column or row: click on the column or row header.
Selecting multiple columns or rows: press and hold <Ctrl>, then click the column or row headers.
Selecting a series of columns or rows: press and hold <Shift>, then click on the first and last column or row headers.
De-selecting an item within a series: release the <Shift> key and hold the <Ctrl> key and click on the item(s) to be de-selected. The rest of the series remains selected.
To use the highlighted items in a plot, right-click on the table viewer and select from the shortcut menu.
If column(s) are selected, genes will plot (as series) across (all) samples.
If row(s) are selected, samples will plot (as series) across (all) genes.
You cannot selectively plot specific genes against specific samples (i.e. you cannot select columns and rows concurrently).
Resizing the Columns
The columns in the table viewer are equal in width, so when you perform a column width adjustment, it affects all columns equally. Note that on large datasets, resizing the columns can be slow.
1. Position the mouse cursor on the divider between two column names. The cursor is drawn as a two headed arrow.
2. Click and drag right to widen the columns, or drag left to shrink the columns.
Related Topics:
Data Import Step 1: Selecting a Template
Creating Gene Lists from Selections

