|
Creating a Cluster Plot
Overview
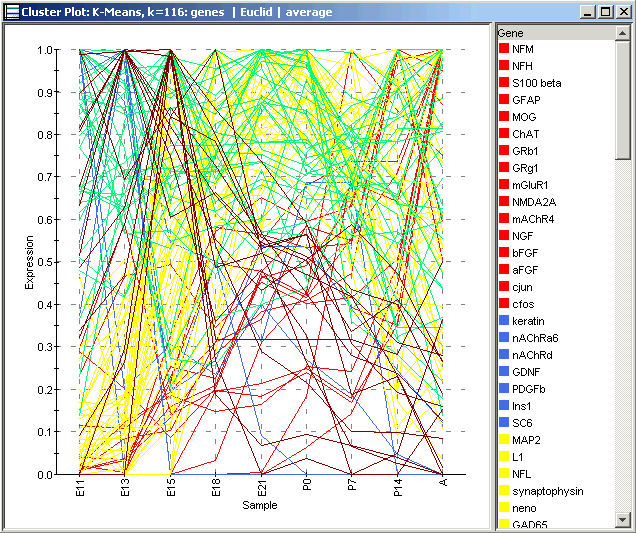
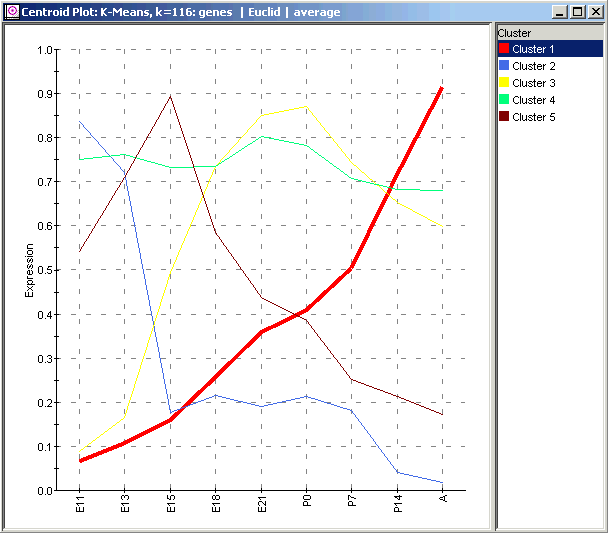
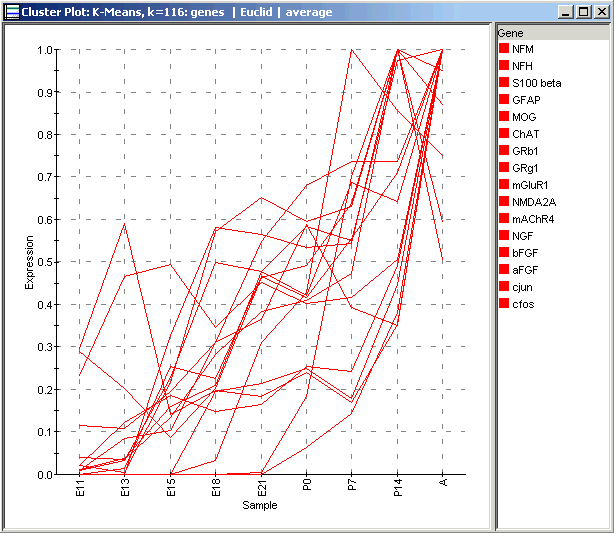
A cluster plot can be used to display the profiles of individual members within a cluster. The cluster plot can be launched from a partitional clustering experiment in the Experiments navigator or from a centroid plot. By selecting one or more cluster centroids and then launching the cluster plot it is possible to visually 'drill down' into the clusters to view the individual member profiles.
Actions
Showing a Cluster Plot of All Clusters
1. Click a Partitional Clustering experiment in the Experiments navigator. The item is highlighted.
2. Select Cluster Plot from the Clustering menu, or right-click the item and select Cluster Plot from the shortcut menu. A cluster plot of the experiment is displayed.

Showing a Cluster Plot of Selected Cluster(s)
1. Click a Partitional Clustering experiment in the Experiments navigator. The item is highlighted.
2. Select Centroid Plot from the Clustering menu, or right-click the item and select Centroid Plot from the shortcut menu. A centroid plot of the experiment is displayed.

3. Select one or more clusters:
Selecting a single cluster: click on a cluster on the plot or click on a name in the legend.
Selecting multiple clusters: press and hold the <Ctrl> key and click on clusters on the plot or in the legend.
Selecting a series of clusters: press and hold the <Shift> key and click on the first and last cluster name in the legend.
4. Select Cluster Plot from the Clustering menu, or right-click on the plot (or a selected legend item) and select Cluster Plot from the shortcut menu. A cluster plot of the selected cluster(s) is displayed.

Using the Plot
Plot Functions
Create Gene List from Selection
Customizing the Plot
Related Topic:

