|
Confusion Matrix
Overview
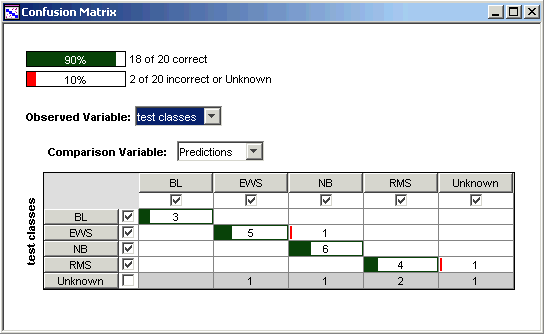
A confusion matrix is a plot used to evaluate the performance of a classifier during supervised learning. It is a matrix plot of the predicted versus the actual classes of the gene expression data.
Actions
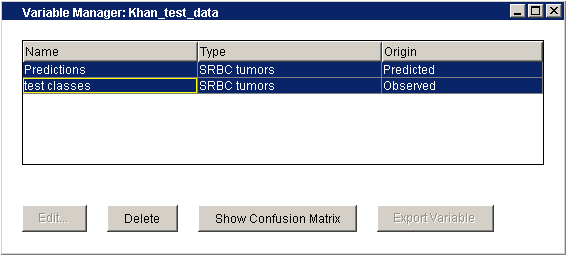
1. Select Variable Manager from the Tools menu. The Variable Manager is displayed.

2. Press and hold the <Ctrl> key and click on the two variables of interest (for example, one predicted and one observed).
3. Click Show Confusion Matrix. The Confusion Matrix is displayed.

Interpretation
A confusion matrix is an array showing relationships between true and predicted classes. Entries on the diagonal of the matrix, in blue, count the correct calls. Entries off the diagonal, in red, count the misclassifications. The totals are shown in light blue.
Note that the unknown class is not included in calculating the accuracy of the classifier.
Related Topics:

