|
Tutorial 1: Step 2 View and Normalize the Data
The table viewer displays a spreadsheet-like view of the data in a dataset.
View the Data with the Table Viewer
1. If the Spinal_cord dataset in the Experiments navigator is not already highlighted, click it.
2. Click the Table
View toolbar icon ![]() , or select Table
View from the Explore menu,
or right-click the item and select Table
View from the shortcut menu. The data is displayed in table form
in the right-hand pane (plots pane).
, or select Table
View from the Explore menu,
or right-click the item and select Table
View from the shortcut menu. The data is displayed in table form
in the right-hand pane (plots pane).

3. Click the right scrollbar arrow at the bottom of the table viewer to scroll right about 6 or 8 genes so you see the genes L1, NFL, and NFM.
Note: NFL expression ranges up to 14.92 and NFM up to 27.69 over the control, while L1 never gets above 0.96 of the control concentration. While the difference between strongly expressed and weakly expressed genes is interesting, it's not what we're currently after. Instead, normalize each gene by dividing by its maximum expression ratio.
To learn more about how to use the table viewer, please see Table Viewer Functions.
Normalize the Data
GeneLinkerô offers multiple normalization, filtering, and other data preprocessing techniques which can be applied one or more times (in various combinations) to a dataset. In this tutorial, the data is normalized by dividing by the maximum. Please see Normalization Overview for details on all of the normalization operations.
1. If the Spinal_cord dataset in the Experiments navigator is not already highlighted, click it.
2. Click the Normalize
toolbar icon ![]() , or select Normalize
from the Data menu, or right-click
the item and select Normalize
from the shortcut menu. The first Normalization
parameters dialog is displayed.
, or select Normalize
from the Data menu, or right-click
the item and select Normalize
from the shortcut menu. The first Normalization
parameters dialog is displayed.

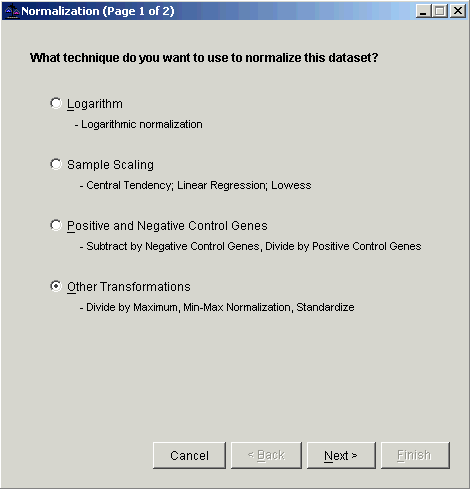
3. Double-click the Other Transformations radio button, or ensure Other Transformations is selected and click Next. The second Normalization dialog is displayed.

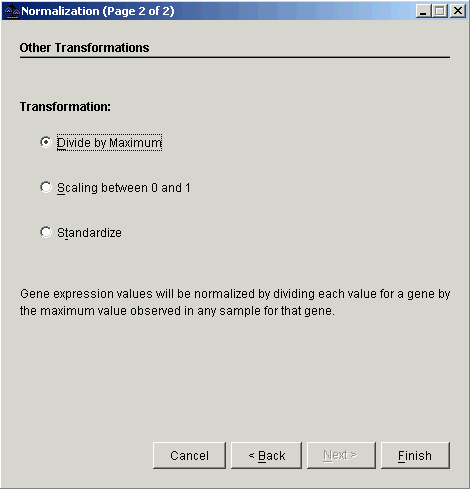
4. Double-click the Divide by Maximum radio button, or ensure Divide by Maximum is selected and click Finish. The Experiment Progress dialog is displayed.

The dialog is dynamically updated as the normalization operation is performed. Upon successful completion, a new Normalization item is added to the Experiments navigator, attached to and below the Spinal_cord raw dataset. It is named something like Normalization (2002-08-01 16:04:50) - using the current date and time.
To learn about cancelling an operation or experiment, please see Cancelling an Operation or Experiment.

