|
Resizing the SOM Plot
Overview
Both the proximity-gradient map and the node/cluster profile can be resized.
Actions
Zooming the Proximity-Gradient Map
1. Select Zoom from the View menu, or right-click the proximity-gradient map and select Zoom from the shortcut menu. The Resize dialog is displayed.

2. Set the Zoom percentage.
3. Click OK. The map is zoomed to the specified percentage.
Resizing the Node/Cluster Profile
1. Right-click on the node/cluster profile (displayed in the lower pane of the window).
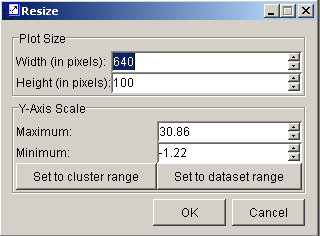
2. Select Resize from the shortcut menu. The Resize dialog is displayed.

|
Element |
Description |
|
Width (in pixels) |
The width of the profile plot. |
|
Height (in pixels) |
The height of the profile plot. |
|
Maximum |
The maximum value of the y-axis. |
|
Minimum |
The minimum value of the y-axis. |
|
Set to cluster range |
Automatically adjust the y-scale to fit the cluster. |
|
Set to dataset range |
Automatically adjust the y-scale to fit the entire dataset. |
3. Set the parameters.
4. Click OK to apply the changes, or click Cancel to keep the previous plot settings.
Related Topics:

