|
Customizing the SOM Plot
Overview
The appearance of the SOM plot proximity-gradient map can be customized. The color gradient used in the background to indicate areas of similarity and several other characteristics can be changed. For complete details about the SOM plot, see Creating a SOM Plot.
Actions
1. Right-click on the proximity-gradient map to display a shortcut menu.
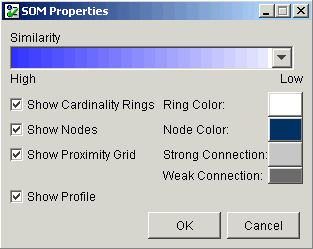
2. Select Customize. The SOM Properties dialog is displayed.

|
Parameter |
Description |
|
Similarity |
The color gradient to use for the proximity-gradient map. |
|
Show Cardinality Rings |
Toggle on (checked) or off (unchecked) to show and hide the cardinality rings. |
|
Ring Color |
The color of the cardinality rings. |
|
Show Nodes |
Toggle on (checked) or off (unchecked) to show and hide the nodes on the map. |
|
Node Color |
The color of the nodes on the map. |
|
Show Proximity Grid |
Toggle on (checked) or off (unchecked) to show and hide the proximity grid. |
|
Strong Connection |
The color associated with high similarity in the proximity grid. |
|
Weak Connection |
The color associated with low similarity in the proximity grid. |
|
Show Profile |
Toggle on (checked) or off (unchecked) to show/hide the profile. |
3. Set the parameters.
4. Click OK to apply the changes, or click Cancel to keep the previous plot settings.
Related Topics:

