|
Profile Matching
Overview
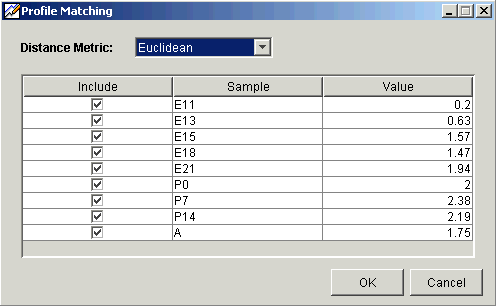
The Profile Matching function is used to reorder the display in a Color Matrix, Matrix Tree, or Two Way Matrix Tree plot based on the profile of one or more selected genes.
Profile Matching can be applied to complete datasets only. If you have an incomplete dataset, you could apply missing value estimation or a filtering operation to create a complete dataset from your original one. Use the new complete dataset for profile matching operations.
Actions
1. Display a Color Matrix Plot of a complete dataset, or a Matrix Tree Plot of a clustered dataset, or a Two Way Matrix Tree Plot of two appropriate clustered datasets.
2. Select a reference.
To select a single gene, click on the name of the gene on the plot. The gene name is highlighted.
To select multiple genes, press and hold the <Ctrl> key and click on the names of the genes on the plot. The selected genes are highlighted.
3. Click the Profile
Matching toolbar icon ![]() , or select
Profile Matching from the Tools
menu, or right-click on the plot and select Profile
Matching from the shortcut menu. The Profile
Matching dialog is displayed.
, or select
Profile Matching from the Tools
menu, or right-click on the plot and select Profile
Matching from the shortcut menu. The Profile
Matching dialog is displayed.

4. Set the Distance Metric for the profile matching calculations.
Note: If you try to perform profile matching using less than the necessary number items, a message is displayed, then the dialog is displayed again so you can select more items.
Pearson Correlation or Pearson Squared, at least two items must be checked.
Spearman, at least three items must be checked.
All others, at least one item must be checked.
5. Under the Include heading, a sample with a checkmark is included in the profile matching calculations. The default is all samples included.
Click an included sample to exclude it.
Click an excluded sample to include it.
6. For a single gene profile match, the values listed under the Profile heading are the actual values for those samples. For a multiple gene profile matching, the values listed under the Profile heading are the average value for those samples for the selected genes. These are the values used in the profile matching calculations. Double-click on a value to edit it. The value you enter is used in place of the original value in the profile matching calculations.
7. Click OK. The Experiment Progress dialog is displayed. It is dynamically updated as the Profile Matching operation is performed. To cancel the Profile Matching operation, click the Cancel button.

The genes in the plot are rearranged with the genes sorted from the best match at the left to the worst match at the right. Note: on a Matrix Tree or Two Way Matrix Tree plot, the tree portion is no longer displayed.
Saving a Profile
a) To save a profile, right-click on the plot and select Save Profile from the shortcut menu or close the plot, and then click Yes on the Save Profile dialog. The Profile Matching item is added to the Experiments navigator pane under the original dataset.
Note that if you exit the application without saving a profile, you will be prompted to do so.
Related Topics:
Creating a Two Way Matrix Tree Plot

