|
3D Plot Functions
Overview
This describes the various techniques available for interacting with 3D plots.
Actions
Displaying the Coordinates of a Point
Hover the mouse pointer over the point. The coordinates show in the area below the plot.
Selecting a Point
Click a point on the plot or click on an item in the legend. The selection is highlighted on the plot and in the legend.
Selecting Multiple Items
Press and hold the <Ctrl> key and click on items in the legend or points on the plot. The items are highlighted in the legend and on the plot.
Selecting a Series of Items
Press and hold the <Shift> key and click on the first and last item in the series on the legend. The items are highlighted in the legend and on the plot. (<Shift>-click has the same behavior as <Ctrl>-click on the plot).
Rotating the Plot
Click on the plot and drag. The plot rotates in the direction the mouse moves.
Zooming the Plot
Press the <Alt> key and then click and drag up or down on the plot.
Drag up to shrink.
Drag down to enlarge.
Panning the Plot
Right-click and drag on the plot.
Displaying the Plot Shortcut Menu
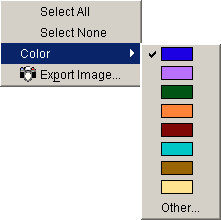
Right-click on the legend to display a shortcut menu:

Select an enabled function item.
|
Element |
Description |
|
Select All |
Select all items on a plot. |
|
Select None |
De-select all items on a plot. |
|
Color |
Select a color from the color context menu. The selected item is re-drawn using the new color. |
|
Export Image |
Export an image of the plot. |
Using Plot Buttons
Click Home
 on the upper part of the plot to return the plot
to its original state.
on the upper part of the plot to return the plot
to its original state.Click Normalize/Raw Data
 on the upper part of the plot to switch between
viewing a plot of the raw data and a plot of the data after it has been
normalized.
Related Topics:
Color By Gene Lists or Variables

