|
Color By Gene Lists or Variables
Overview
The color matrix, matrix tree, two way matrix tree, scatter, and 3D score plots can be colored by gene list membership and/or by variable. The loadings color matrix plot can be colored by variable only.
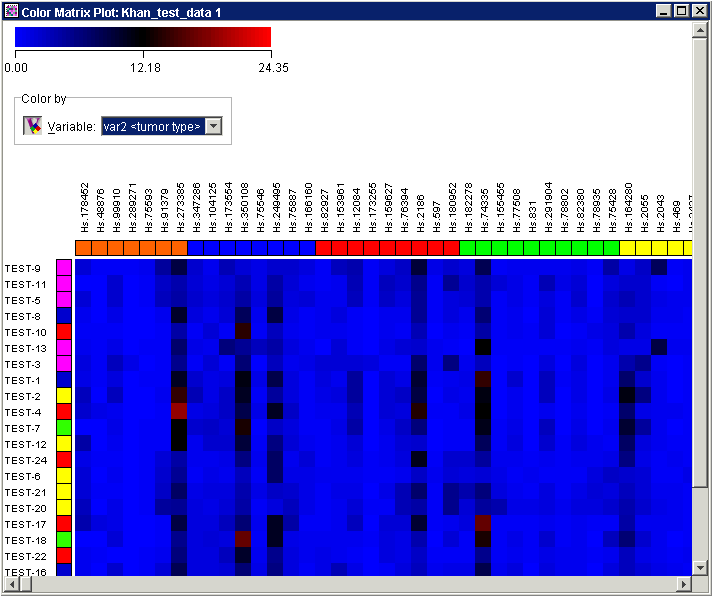
When color by gene list is enabled, the color indicator box just below each gene name label is colored according to the color plan specified in the color manager.
When color by variable is enabled, the color indicator box just beside each sample name label is colored according to the color plan specified in the color manager.
When both color by gene list and variable are enabled, the gene list and variable color indicator boxes are colored according to the color plan specified in the color manager..
Actions
Color Matrix, Loadings Color Matrix (Color by Variable only), Matrix Tree, Scatter, or Two Way Matrix Tree Plot
Coloring by Variable
1. Select a variable item from the Color Scheme list box at the top of the plot in the Color by group. Note: the Color by group is on the plot only if there are variables associated with the displayed dataset or experiment.
2. Click the Color Variable button at the top of the plot (pressed = on). The indicator boxes are colored according to the selected class variable item using the color scheme defined in the Color Manager.
Coloring by Gene List
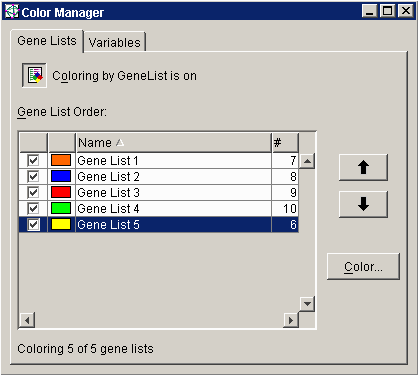
1. Select Color Manager from the Tools menu. The Color Manager dialog is displayed.

2. Click the Gene Lists tab.
3. Check the boxes to the left of the gene lists to select them.
4. Click the Coloring by Gene List button to turn on this feature ('is on' is appended to the button name when it is on). The gene names are colored according to list membership in order of priority.

Note: for the color indicator boxes to be drawn for genes and/or samples, the color tiles must be at least 10 pixels in width and/or height.
3D Score Plot
Coloring by Gene List
1. Select Color Manager from the Tools menu. The Color Manager dialog is displayed.

2. Check the boxes to the left of the gene lists to select them.
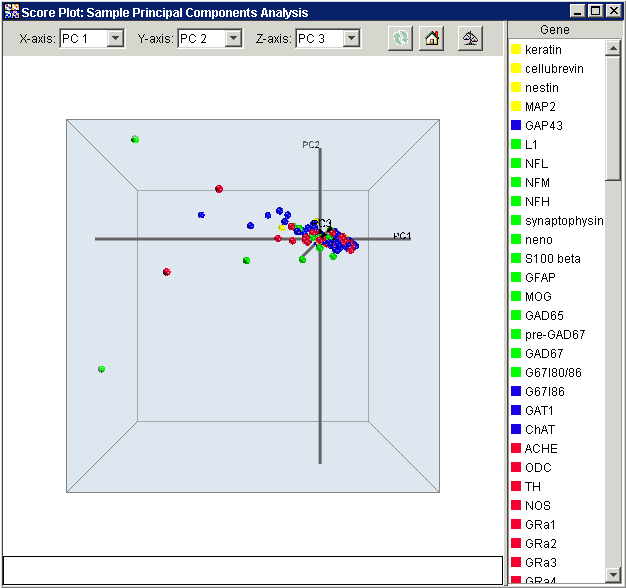
3. Click the Coloring by Gene List button to turn on this feature ('is on' is appended to the button name when it is on). The gene names and corresponding points on the plot are colored according to list membership in order of priority.

Coloring by Variable
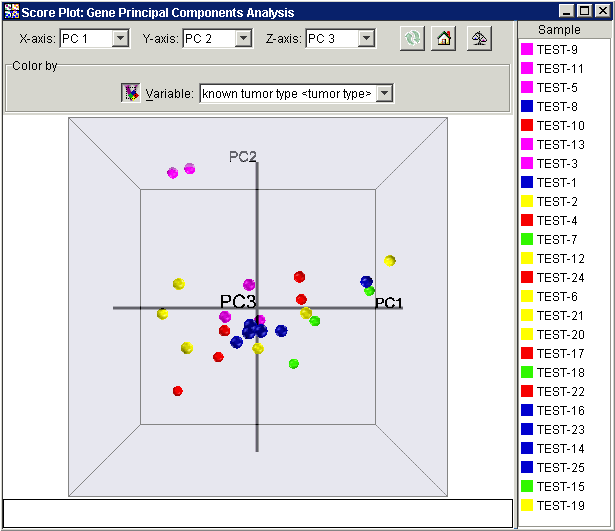
1. Click the Color Scheme button in the upper left of the plot to turn on color by variable (pressed = on). The sample names and corresponding points on the plot are colored according to their class. To edit the color scheme, use the Color Manager (variables tab).

Related Topics:

