|
Platinum
MSE Plot
Overview
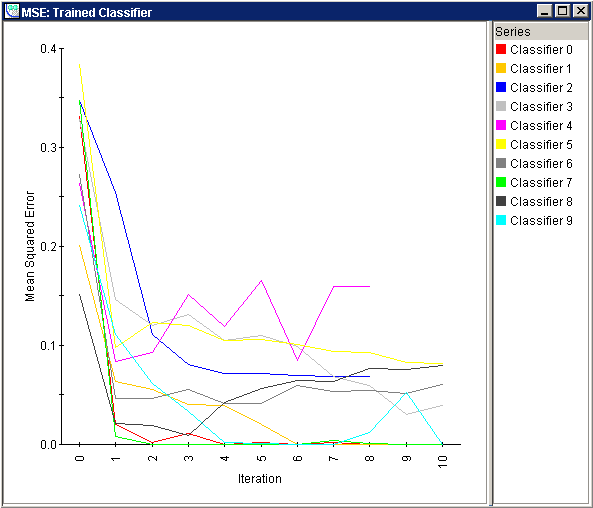
The Mean Squared Error plot shows the results for each component learner in a training run.
Actions
1. Click an ANN Classifier in the Experiments navigator. The item is highlighted.
2. Select Mean Squared Error Plot from the Predict menu, or right-click on the item and select Mean Squared Error Plot. The training results are displayed.

Interpretation
The MSE is computed by taking the differences between the target and the actual neural network output, squaring them and averaging over all classes and internal validation samples. Because the neural network outputs are real numbers between 0 and 1, this results in a Mean Squared Error between 0 and 1. As the neural network is iteratively trained, the MSE should drop to some small, stable value. Each neural network (component classifier) has its MSE plotted independently. Some components may stop if they reach stability earlier than others, and hence have MSE plots which do not extend over all iterations.
This plot may be used to diagnose certain types of training problems. If several component classifiers show large MSE values even at the end of training, it may be desirable to adjust the training parameters and try again. For instance, the number of hidden units might be increased, the maximum iterations in the stopping criteria might be increased, or the conjugate gradient method or steps number might be changed. If on the other hand only one or two component classifiers show large MSEs at the end, it may indicate inconsistencies between training samples. Consult the Classification Plot and look for samples which show inconsistent voting or 'untidy' histograms. In this case the voting structure of the classifier might result in reasonable classification despite problems with individual component learners.
Related Topics:

