|
Sample Workflow Using Spotted Array N-Fold Culling With Log Transformation
Overview
This workflow is used for ratio (Cy3/Cy5) data to filter out genes that do not show a large induction or repression in any sample in the dataset, and then to log normalize the data so that inductions and repressions have equal but opposite sign. You must specify the value for the N-fold filtering operation. For example, if you specify 2, then genes that show a value of 2 or greater (induction) or a value of 1/2 or less (repression) remain in the dataset after filtering. This operation discards genes that do not show significant expression changes. Following filtering, a log normalization operation is used to give inductions and repressions equal but opposite sign. In our example above, log2 2 = 1 and log2 1/2 = -1.
Note: selecting a value of less than or equal to 0.0 is not allowed.
Actions
1. Click the Perou dataset in the Experiments navigator (if the Perou item is not there, import the Perou dataset). The item is highlighted. Note that the Description Pane (under the Navigator) reports the number of genes/samples (approximately 5600 genes in this example).
2. Click the Filter
toolbar icon![]() , or select Filter
Genes from the Data menu,
or right-click the item and select Filter
Genes from the shortcut menu. The Filter
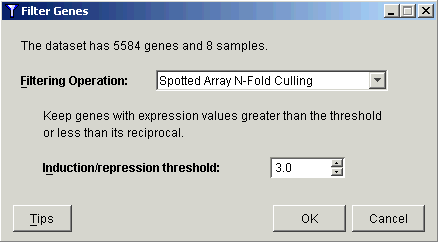
Genes parameters dialog is displayed.
, or select Filter
Genes from the Data menu,
or right-click the item and select Filter
Genes from the shortcut menu. The Filter
Genes parameters dialog is displayed.

3. Select Spotted Array N-Fold Culling from the Filtering Operation drop-down list.
4. Set the Induction/repression threshold to 3.0.
5. Click OK. The Experiment Progress dialog is displayed.

The dialog is dynamically updated as the filtering operation is performed. Upon successful completion, a new filtered dataset is added to the Experiments navigator pane under the original dataset.
Setting the threshold value to 3.0 in this example reduces the number of genes down to approximately 460.
6. Click the filtered dataset in the Experiments navigator. The dataset is highlighted.
7. Click the Normalize
toolbar icon ![]() , or select Normalize
from the Data menu, or right-click
the item and select Normalize
from the shortcut menu. The first Normalization
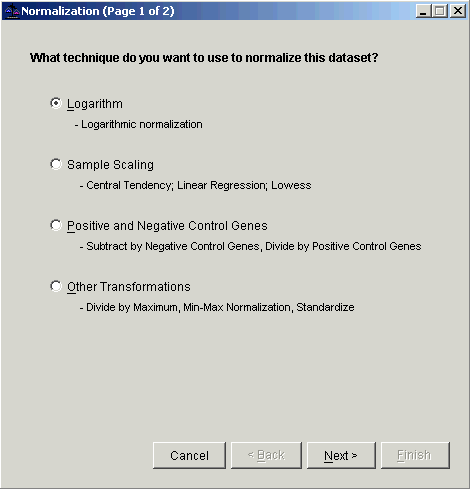
parameters dialog is displayed.
, or select Normalize
from the Data menu, or right-click
the item and select Normalize
from the shortcut menu. The first Normalization
parameters dialog is displayed.

8. Double-click the Logarithm radio button, or ensure Logarithm is selected and click Next. The second Normalization dialog is displayed.

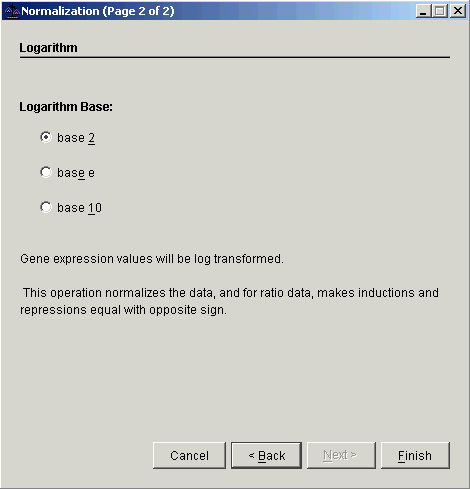
9. Double-click the base 2 radio button, or ensure base 2 is selected and click Finish. The normalization operation is performed and upon successful completion, a new normalization item is added to the Experiments navigator pane under the filtered dataset.
10. At this point you can try applying Hierarchical or K-Means partitional clustering on the data. (Right-click the item in the Experiments navigator and make selections from the shortcut menu.)
Related Topics:
Performing Agglomerative Hierarchical Clustering

