|
Lowess
Overview
Lowess normalization is a method used to normalize a two-color array gene expression dataset to compensate for non-linear dye-bias. In this approach, the log-ratio for each sample is adjusted by the Lowess fitted value. The result is a dataset of corrected ratios (not log ratios). See Overview of Lowess Normalization for complete information.
Visualization
To determine whether or not Lowess normalization is appropriate for a dataset, display an intensity-bias plot of a sample ratio.
Actions
1. Click a two-color dataset in the Experiments navigator. The item is highlighted.
2. Click the Normalization
toolbar icon ![]() , or select Normalize
from the Data menu, or right-click
the item and select Normalize
from the shortcut menu. The first Normalization
dialog is displayed.
, or select Normalize
from the Data menu, or right-click
the item and select Normalize
from the shortcut menu. The first Normalization
dialog is displayed.

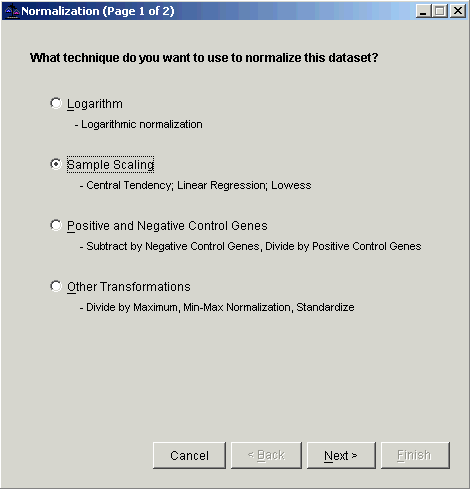
3. Select Sample Scaling. The second Normalization dialog is displayed.

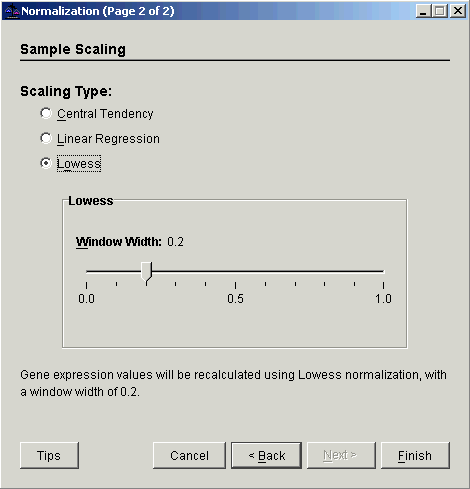
4. Select Lowess.
5. Set the Window Width parameter.
7. Click Finish. The Experiment Progress dialog is displayed. It is dynamically updated as the Lowess normalization operation is performed.

If the operation cannot complete an error message is displayed. The operation will fail, for example, if the mean of any sample is zero or near zero.
Upon successful completion, a new normalization dataset is added under the original dataset in the Experiments navigator.
Visualization
An intensity-bias plot of the Lowess-corrected data can be made from the corrected data by creating a table view, selecting the desired row, and selecting Intensity-Bias Plot from the Explore menu as described above.
Related Topics:
Creating an Intensity-Bias Plot of a Sample Ratio
Subtraction of Central Tendency

