|
Creating an Intensity-Bias Plot of a Sample Ratio
Overview
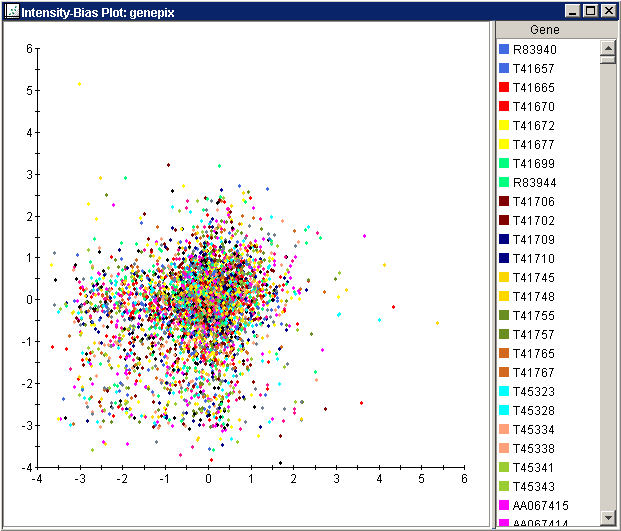
An intensity-bias plot can be used to view dye biases to determine whether normalization is required. An intensity-bias plot is a scatter plot of the log-ratio versus the log-intensity.
Actions
1. Click a two-color dataset in the Experiments navigator. The item is highlighted.
2. Click the Table
View toolbar icon ![]() , or select Table
View from the Data menu,
or right-click the item and select Table
View from the shortcut menu. A table view of the dataset is displayed.
, or select Table
View from the Data menu,
or right-click the item and select Table
View from the shortcut menu. A table view of the dataset is displayed.

3. Click on the name of a sample. The sample is highlighted.
4. Select Intensity-Bias Plot from the Explore menu. An intensity-bias plot of the highlighted sample is displayed.

Related Topics:
Subtraction of Central Tendency

