|
ANOVA Viewer
Overview
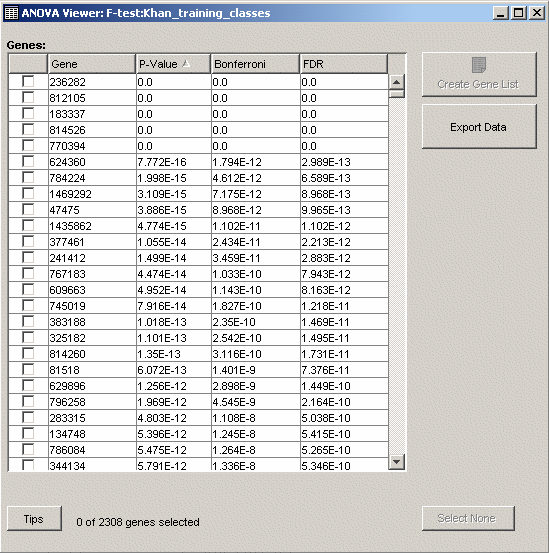
The ANOVA Viewer displays a list of the genes and their associated p-values from an F-Test Results or a Kruskal-Wallis Results item in the Experiments navigator. The list can be sorted, and genes can be selected for creating gene lists.
The first column of the viewer contains checkboxes indicating whether a gene is checked or not (unchecked). The second column contains index numbers. The index numbers are not associated with the genes, they merely indicate position within the current sort context. The third column contains gene names, and the fourth contains p-values.
Actions
1. Double-click an F-test Results or Kruskal-Wallis (K-W test) Results item in the Experiments navigator, or click the item and select ANOVA Viewer from the Statistics menu. The item is highlighted and the ANOVA Viewer is displayed.

P-Value, Bonferroni and False Discovery Rate
The P-Value is the probability of a gene having such a large difference between classes by random chance if there really is no difference in the gene's underlying distribution for samples of each class. The Bonferroni-corrected P-Value is the P-Value multiplied by the number of genes in the experiment, and is equal to the number of genes we would expect to have such small P-Values by chance given the size of the experiment. For example, in an experiment with 1000 genes, we would expect on average one of them to have a P-Value as small as 0.001. The False Discovery Rate (FDR) is the fraction of the genes at or below a given P-Value that are expected to have such small P-Values by chance: it is numerically equal to the Bonferroni-corrected P-Value divided by the number of genes with P-Values that small or smaller.
Sorting the Genes
The default sort for the contents of the ANOVA Viewer is by ascending P-Value. This sort places the genes with the most significant P-values at the top of the list.
The list can be sorted by Gene (alphabetical, or reverse alphabetical) or by P-Value (ascending or descending). Sorting by Bonferroni-corrected P-Value and False Discovery Rate (FDR) is also possible. The Bonferroni-ordering will always be identical to the P-Value ordering.
Checking Genes
A checked box in the first column indicates that the gene is checked.
To check a gene, click on the empty checkbox next to the gene.
To uncheck a gene, click on the checked checkbox next to the gene.
To check a series of genes, press and hold the <shift> key and click on the first and last gene checkboxes. All the genes between the first and last inclusive are selected.
Creating a Gene List
1. Check one or more genes.
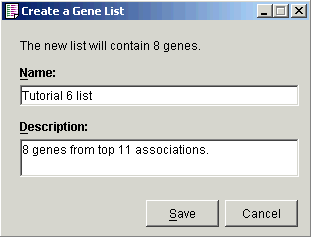
2. Click Create Gene List. The Create a Gene List dialog is displayed.

3. Provide a Name and optionally a Description for the gene list.
4. Click OK. The gene list is created and a new item is added to the Gene Lists navigator.
Related Topics:

