|
Platinum
SLAMô Association Viewer
Overview
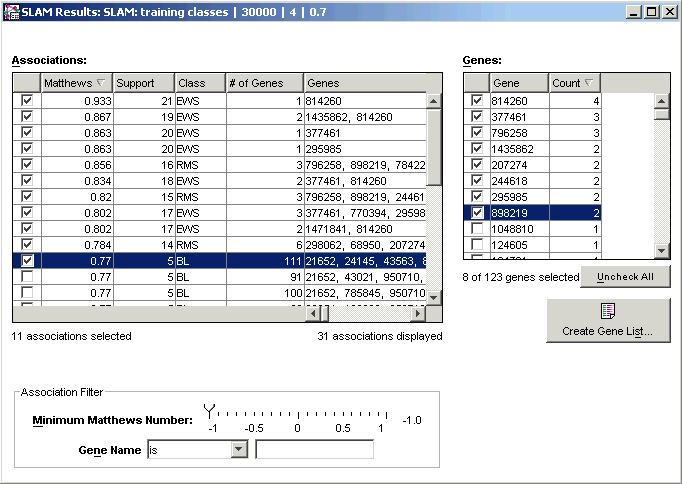
The SLAMô association viewer is used to visualize the associations found by SLAMô and to create gene lists. Associations are patterns of a certain value of the target variable co-occurring with certain values of certain genes. For each association, the viewer displays its Matthews correlation, support statistic (the number of samples in the dataset which contain the pattern), class, number of genes in the association, and the list of the gene identifiers.
The Matthews correlation measures the 'interestingness' of an association. More precisely, it measures how well the association can be used to predict its class. If all the samples in a dataset are labelled as true positive (TP), true negative (TN), false positive (FP) or false negative (FN)depending on whether both the expression pattern and the class match the association, then:

This gives a value between 1 (very interesting) and -1 (anti-predictive), with a value of zero representing no useful information. Thus values of the Matthews correlation below about 0.5 are unlikely to be of great interest, and values below zero are unlikely to occur.
Support is easier to understand but less powerful than Matthews correlation. The support is simply the number of instances (samples) in the dataset which match the association pattern. In other words, it is the number of true positives (TP) in the Matthews computation. Because SLAM may identify patterns which only cover part of a certain class -- e.g. previously unrecognized molecular subtypes of a cancer -- it is important to remember that a large support number does not necessarily identify a useful association: There may be very interesting (high Matthews) patterns which characterize only parts of the entire dataset and hence have low support.
Actions
1. Double-click a SLAM experiment in the Experiments navigator. The item is highlighted and the SLAM association viewer is displayed.
OR
1. Click a SLAM experiment in the Experiments navigator. The item is highlighted.
2. Click the Association
Viewer toolbar icon ![]() , or select Association
Viewer from the Predict
menu, or right-click the SLAM item and select Association
Viewer from the shortcut menu. The SLAM association viewer is displayed.
, or select Association
Viewer from the Predict
menu, or right-click the SLAM item and select Association
Viewer from the shortcut menu. The SLAM association viewer is displayed.

Creating a Gene List
The SLAMô association viewer lists the associations on the left and has a place to create a gene list on the right. To populate the gene list, select associations by clicking on the checkboxes next to them in the associations list.
Sorting
To sort the Association list, click on a column header (except Genes). The association list is sorted by that characteristic in the direction indicated by the arrowhead in the column header. The sorting process behaves in a cumulative multi-level manner. Each successive time you click on a column header to sort the list, that characteristic becomes the primary sort key. Previous sorts are maintained in descending order of importance.
To sort the Gene List, click on a column header.
Using the Association Filter
This filter is a real-time control of what is seen in the association list. Click and drag the Minimum Matthews Number slider to expand or contract the number of associations displayed in the association list. The list is updated when you release the mouse button.
To filter the associations by a gene name characteristic, select the characteristic using the drop down list (choices are: is, starts with, contains, does not contain and ends with) and type the gene name or fragment into the text box. The association list is updated (with a slight delay) as you type.
Related Topics:

