|
Tutorial 2: Step 10 Generate Report and Export Image
Generate an Experiment Report
1. Click the Sample Hierarchical Clustering experiment in the Experiments navigator. The item is highlighted.
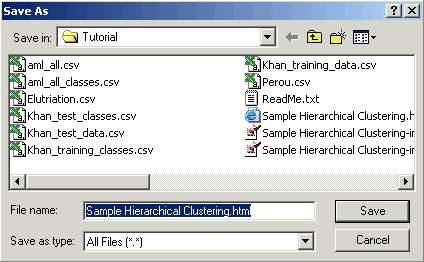
2. Select Generate Report from the File menu. The Save As dialog is displayed.

3. Type in a file name or use the provided default.
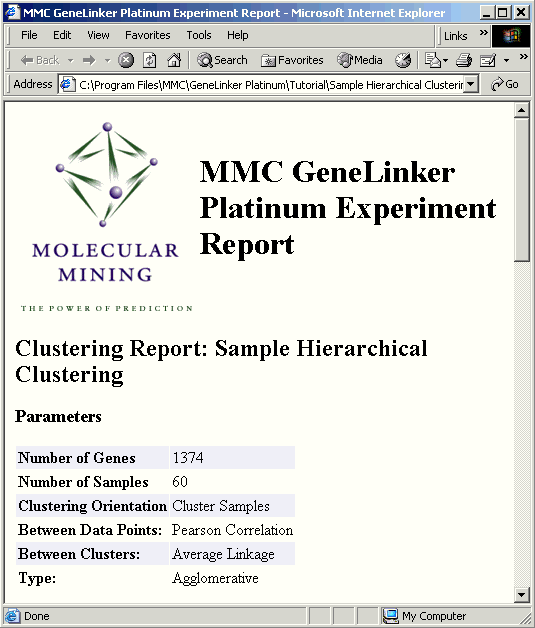
4. Click Save. A report of the clustering results is created in HTML format. It is saved to your disk and your browser is started displaying the report.

Note: the length of the report is proportional to the size of the dataset.
Export an Image
1. Right-click in the matrix tree plot and select Hide Color Matrix in the shortcut menu.
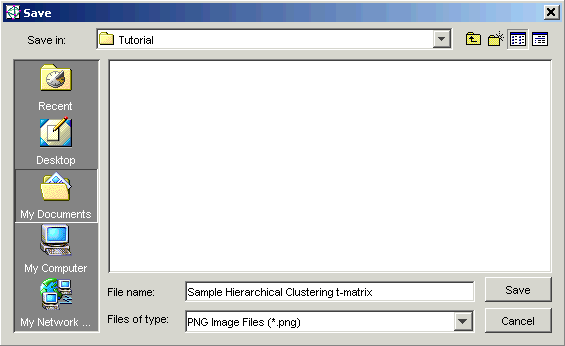
2. With the color matrix turned off, right-click on the plot and select Export Image from the shortcut menu. The Save dialog is displayed.

3. Navigate to the folder where you want the image file saved.
4. Type in a File name for the image file.
5. Select an image file format from the Save as type drop-down list. The options are .png, .svg and .pdf. See Exporting an Image for full details.
6. Click Save. GeneLinkerô exports an image file of the specified type to the specified location.
Other methods for visualizing clustered data are available, such as a Centroid Plot or Cluster Plot. Creating these is described in detail in Tutorial 1.

