|


GeneLinker™ Tour - Main Window Layout
Overview
GeneLinker™ runs in one main window. At the top of the window is the menu bar and the toolbar. The work area is divided into three panes (outlined in red): the navigator, the description pane, and the plots pane. At the bottom is the status bar.
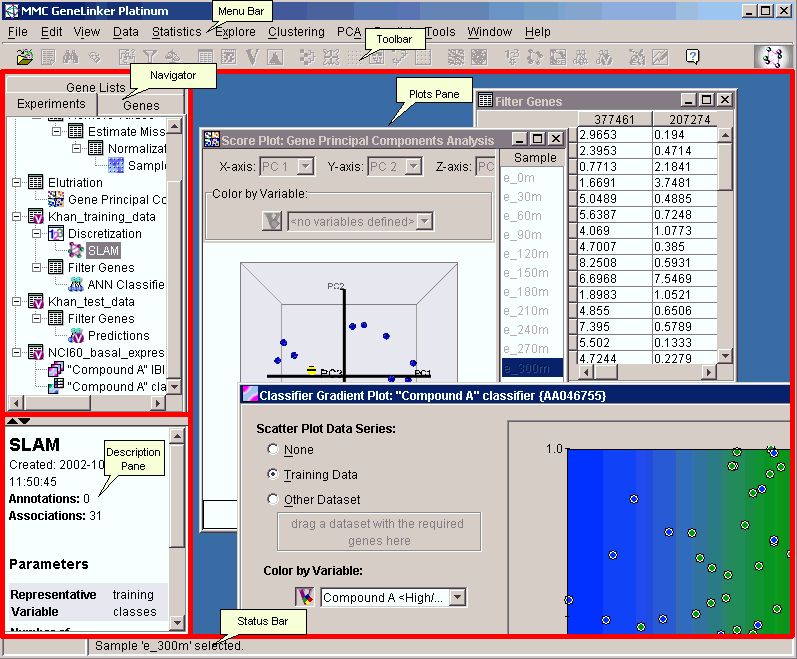
The Navigator (upper left)
The navigator organizes your data and gives you access to it. All items listed in the navigator have already been saved into the GeneLinker™ database. There are three tabs in this pane, each listing a specific type of data.
The Experiments tab displays a hierarchical tree of your datasets and experiments. Each item in the tree is tagged with an icon to indicate its type (e.g. dataset, hierarchical clustering experiment, principal components experiment, etc.).
The Genes tab displays an alphabetical listing of all your genes.
The Gene Lists tab displays an alphabetical listing of all of your gene lists.
Clicking a tab brings it to the front. Clicking an item in the navigator highlights it and makes it the selected item. Information about the selected item is displayed in the description pane. Program functions are applied to the selected item.
The Description Pane (lower left)
The description pane displays information about the item selected in the navigator, or a gene selected in a table or plot. This information can include the name of the item, the number of genes and samples it contains, its creation date, parameters used in its creation (if it is an experiment), and so forth.
The Plots Pane (right)
The plots pane is the place for visualizing your data and experiments. When you use the table viewer or a create a plot, it is displayed in the plots pane. The plots in the plot pane can be arranged by dragging them or by using the Cascade Windows item on the Window menu.
Shortcuts and Tips
GeneLinker™ was designed for ease of use. Right-clicking an item (such as a dataset, or gene in the navigator or on a plot) displays a shortcut menu giving you quick access to its functions.
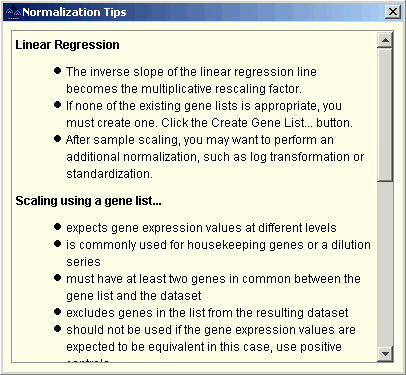
Most dialogs (such as normalization or filtering) have a Tips button. Clicking Tips displays a brief description of the function and how to use it. For example:
If you want to know what function an icon invokes, hover the mouse over the icon for a moment. A tooltip is displayed naming the function.